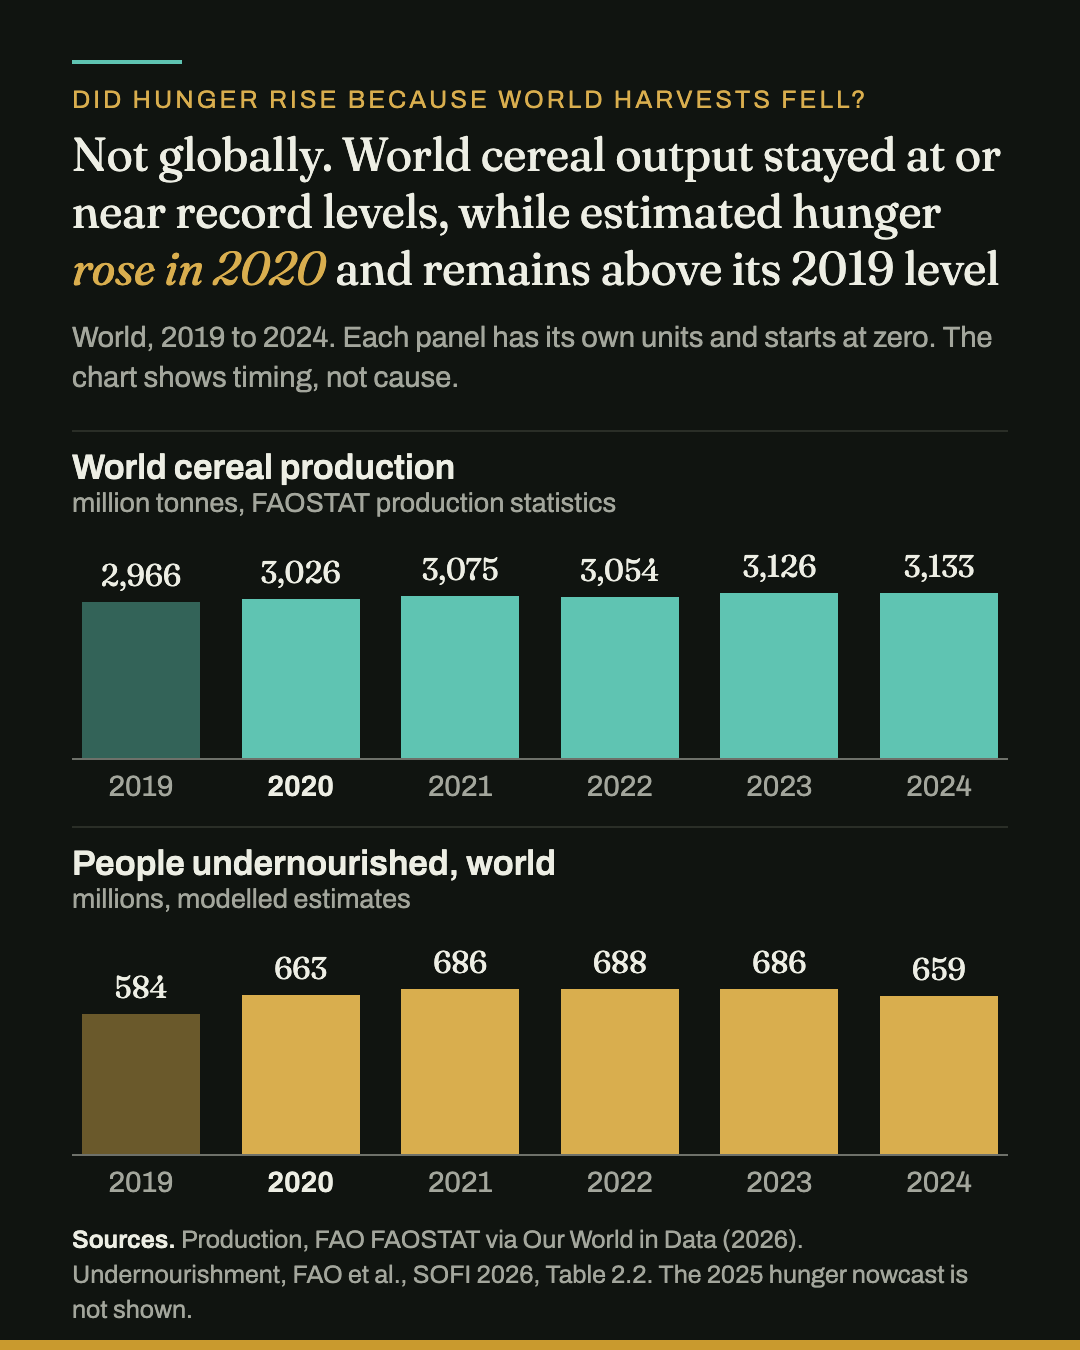
In 2020, the world harvested more cereal than in any year before, about 2 percent more than in 2019, according to FAO production data. In the same year, the estimated number of undernourished people rose from 584 million to 663 million, according to the UN's State of Food Security and Nutrition in the World 2026 report (Table 2.2). Undernourished here means regularly eating too few calories for a normal, active and healthy life. These are modelled estimates, which FAO revises each year.
It is tempting to assume one of these numbers must be wrong. Neither is. They measure different things. One counts food grown. The other estimates whether people could get enough of it to eat.
This article explains how both can be true, what harvest figures cannot establish, and what further evidence a programme needs before concluding that people have enough to eat.
Hunger depends on access, not only on supply
In Poverty and Famines, the economist Amartya Sen argued that starvation is about people's relationship to food, and in particular their ownership of it, rather than about the food supply as such. His subject was famine, an extreme condition classified using its own criteria. The global measure in this article tracks something broader, chronic calorie shortfall across whole populations. Sen's distinction applies to both.
In practice, a household's access depends on links that a harvest figure does not capture. Food has to be on sale where people live, and people have to be able to reach it safely. The household then needs income, or support, to buy it at local prices. Any of these links can fail in a year of good harvests.
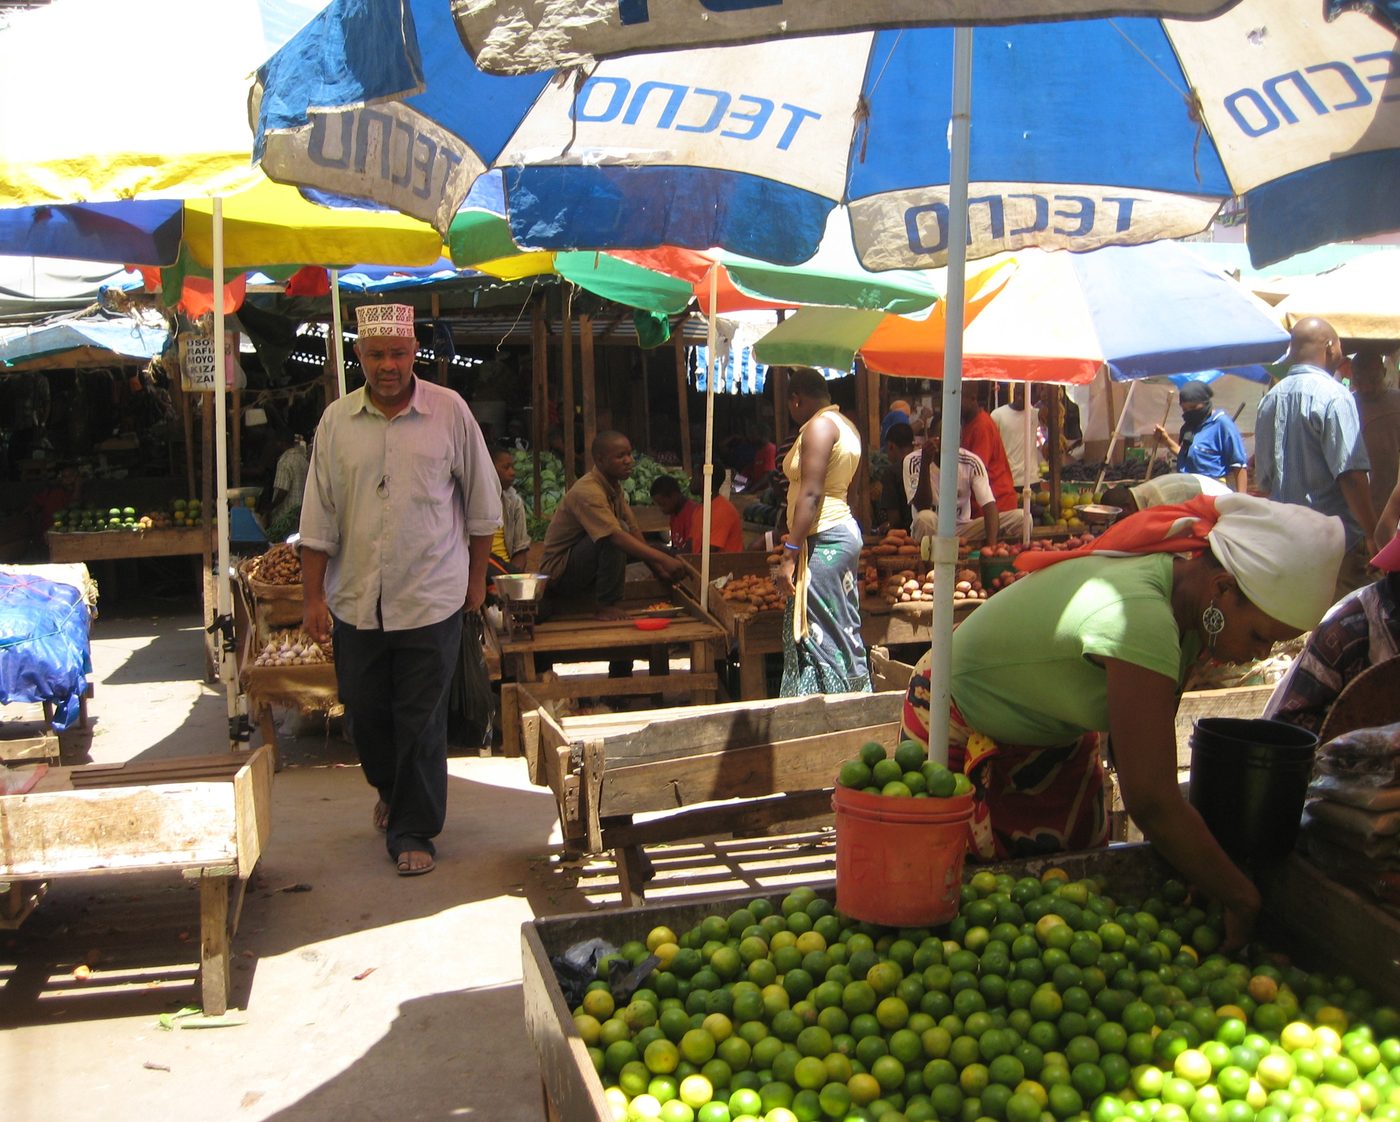
When FAO published its first estimates for 2020, in July 2021, it judged that much of the rise in hunger was "likely related to the fallout of COVID-19". The pandemic, it said, triggered recessions that jeopardised access to food. That is the report authors' assessment rather than a measured breakdown of causes. The household evidence is worth examining directly.
Households lost income and market access in a year of plentiful grain
Egger and colleagues (2021), writing in Science Advances, assembled 16 household phone surveys with more than 30,000 respondents in nine countries across Africa, Asia and Latin America, carried out between April and June 2020. In the median sample, about 70 percent of respondents reported a drop in income. A median of 31 percent reported reduced access to markets, and a median of 45 percent reported missing meals or cutting portions, with samples ranging from 9 to 87 percent.
Prices appear in the data too, though not everywhere. In one Sierra Leone sample in the same study, households faced food prices 19 percent higher than before the crisis.
These surveys covered particular populations in the first months of the pandemic, and they cannot be scaled up to a global estimate. They do show these links failing in real households, with incomes and market access falling while world grain production was at a record high.
The wider economic evidence is consistent. The World Bank estimated in 2022 that the pandemic pushed about 70 million people into extreme poverty in 2020. It also found that the poorest 40 percent lost 4 percent of their income on average, double the loss of the richest 20 percent.
A record cereal harvest is not a record of food on plates
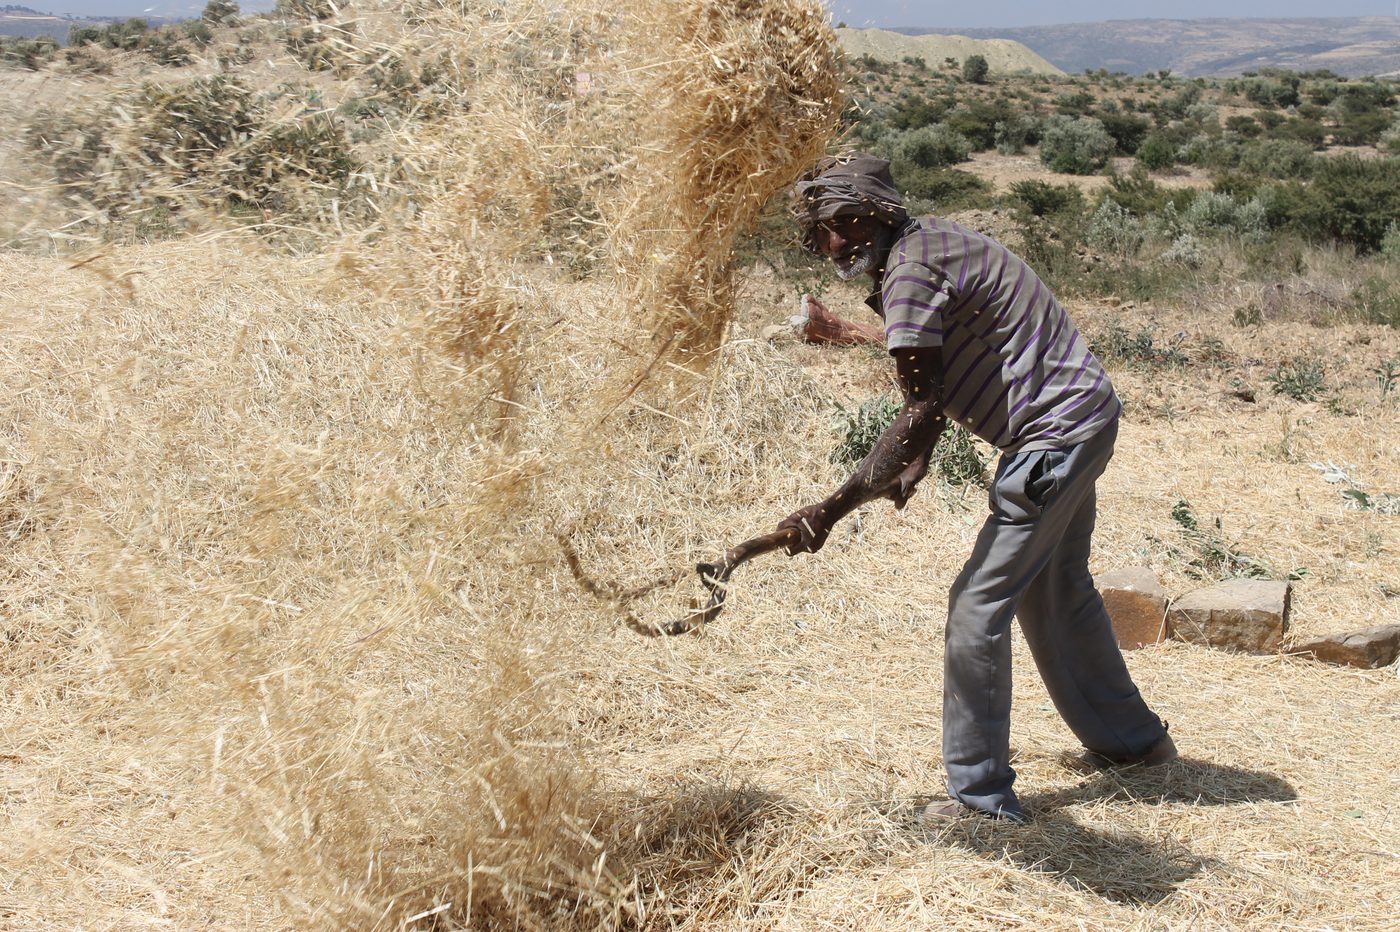
The harvest record itself is sound. FAOSTAT, FAO's statistical database, shows world cereal production rising from 2,966 million tonnes in 2019 to 3,026 million tonnes in 2020, higher than any earlier year. FAO's market forecast in December 2020, which counts rice differently and gives a lower total, already described 2020 output as "still a record high".
Cereals are only part of the food supply, however, and not all cereals become food. In 2020, about 39 percent of the cereals used worldwide for food, feed and industry went to animal feed and about 10 percent to industrial uses such as biofuel, according to FAO food balance data compiled by Our World in Data.
A closer measure of food available to eat is the daily calorie supply per person, calculated from national food balance sheets. It rose only slightly in 2020, from about 2,932 to 2,943 kilocalories. Even this is supply, not consumption. It describes the average amount available, not who ate it.
The hunger estimate itself draws on evidence about access
The hunger figure is not simply a harvest statistic turned upside down. FAO's methodological notes explain that its estimate does not count hungry people one by one. It combines the average calories available per person, how unequally those calories are consumed across households, and how many calories people need.
Household surveys that measure that inequality are rare. For 2020 onwards, in countries without a recent survey, FAO projects the change from the Food Insecurity Experience Scale, a short set of questions about people's own experience of running short of food. The 2020 estimate therefore incorporates survey evidence about access, not only supply. FAO reports a range of 8.0 to 8.7 percent of the world's population for that year (Table S2.1), reflecting the uncertainty in this step.
Two cautions apply. SOFI 2026's methodological notes do not break down the 2020 change into supply and inequality. And a small rise in the world's average supply does not show that supply rose in every country where hunger is concentrated.
Conflict and weather shaped a different kind of hunger
The pandemic was not the whole story. The Global Report on Food Crises 2021 measures acute food insecurity severe enough to need urgent help, in countries that request outside assistance. For 2020 it counted at least 155 million people in 55 countries and territories, up from about 135 million in 2019.
In 2022, the report's partners identified conflict as the main driver for around 99 million of those people, in 23 countries and territories. Economic shocks, mainly linked to COVID-19, were the main driver for over 40 million, and weather extremes for 15.7 million.
These numbers cannot be added to the global undernourishment estimate, because they cover different countries and measure acute crisis rather than chronic shortfall. I treat them as context rather than as an explanation of the global change. In my reading, they show that whether people can safely reach markets and aid can matter as much as the size of the world's harvest.
What the harvest figure cannot establish
The 2020 example has limits of its own. Global totals can hide opposite trends between and within countries. Undernourishment concerns calories, not diet quality, and the 2021 edition of the same UN report estimated that around 3 billion people could not afford a healthy diet in 2019, a different problem again. The hunger figures remain modelled estimates.
Within those limits, the answer to the question is clear. Record production and rising hunger coexisted in 2020 because a harvest figure measures how much grain is grown, while hunger depends on whether people can obtain enough food. The evidence I reviewed points to lost incomes and disrupted access, with conflict shaping acute crises in particular places. None of it establishes the precise contribution of each.
What I would ask of programme evidence
The recommendations below are my judgement, drawn from the evidence above.
First, treat a strong harvest as a supply signal, never as evidence that households can eat. A national or global production figure is a starting point for analysis, not a conclusion.
Second, pair production data with direct indicators of access. These include incomes or wages relative to local food prices, whether people can reach markets, and household measures such as the Food Insecurity Experience Scale or reports of skipped meals.
Third, disaggregate. The World Bank's estimates for 2020 show the poorest households losing proportionally more income than the richest. An average hides exactly the people a programme exists to reach.
Fourth, plan for speed. The surveys behind the Egger study were in the field within weeks of lockdowns beginning. Programmes that can collect household data by phone when a shock hits can see access failing sooner than annual statistics allow.
None of this makes production unimportant. A poor harvest remains a serious risk. The lesson of 2020 is narrower. A good harvest is not, on its own, good news for the people we are trying to reach.
Join the conversation
If you work in early warning, monitoring or programme design, I would like to hear which access indicator has proved most useful when production figures looked reassuring.
This article was first published on LinkedIn on 25 September 2026. Read the original and the discussion there.
Sources
- FAO FAOSTAT, Production, Crops and livestock products, via Our World in Data. Cereal production. Data downloaded 25 September 2026.
- FAO, IFAD, UNICEF, WFP and WHO (2026) The State of Food Security and Nutrition in the World 2026. Section 2.1, Tables 2.1 to 2.4.
- FAO, IFAD, UNICEF, WFP and WHO (2026) The State of Food Security and Nutrition in the World 2026, Annex 1B, methodological notes.
- FAO, IFAD, UNICEF, WFP and WHO (2026) The State of Food Security and Nutrition in the World 2026, supplementary material to Chapter 2. Section S2.1 and Table S2.1.
- Sen, A. Poverty and Famines. An Essay on Entitlement and Deprivation. Oxford University Press.
- FAO (2021) UN report. Pandemic year marked by spike in world hunger. News release, 12 July 2021.
- Egger, D., Miguel, E., Warren, S.S., Shenoy, A., Collins, E., Karlan, D. et al. (2021) Falling living standards during the COVID-19 crisis. Quantitative evidence from nine developing countries. Science Advances, 7(6).
- World Bank (2022) Global progress in reducing extreme poverty grinds to a halt. Press release, 5 October 2022.
- FAO (2020) FAO Food Price Index rises sharply. News release, 3 December 2020.
- FAO food balance sheets via Our World in Data. Share of cereals allocated to animal feed.
- FAO food balance sheets via Our World in Data. Share of cereals allocated to other uses such as biofuel.
- FAO food balance sheets via Our World in Data. Daily calorie supply per person.
- Food Security Information Network (2021) Global Report on Food Crises 2021.
- FAO (2022) Global Report on Food Crises. Acute food insecurity hits new highs. News release.
- FAO, IFAD, UNICEF, WFP and WHO (2021) The State of Food Security and Nutrition in the World 2021, interactive summary.